


Technologies of CLST
ZENBU: Interactive visualization and analysis genome browser system
ZENBU is powerful enough to enable dynamic reconfiguration and embedded processing so that it can be utilized as a research tool during the collaboration process and just for final presentation of data with publications.
Background
With the appearance of Next-Generation short-read sequencing technology applied to protocols such as CAGE, RNA-seq, and ChIP-seq, genome science has seen an explosion of data for analysis and visualization.
Where 10 years ago, a dozen experiments were considered a lot, now it is not uncommon for small labs to generate 100s and large consortium (like FANTOM, ENCODE, TCGA) to generate 1000s or 10,000s of experimental results.
But most of the existing bioinformatics tools for analysis and visualization are still based on the old paradigm of reducing and simplifying the data down to something that can be loaded into the memory of a computer, or visualized in a simple static manner.
ZENBU Genome Browser
The ZENBU Genome Browser was developed at RIKEN for the FANTOM 5 project. FANTOM5 needed a more powerful genome browser system which could manage CAGE & RNA-seq transcriptomics data from 1000s of different cell and tissue samples.
ZENBU is a Next-Generation Sequencing (NGS) focused genome browser for transcriptomics and epigenetics data.
- Work directly with sequence alignment files (BAM) from CAGE, RNA-seq, ChIP-seq…
- Powerful embedded data processing/analysis modules
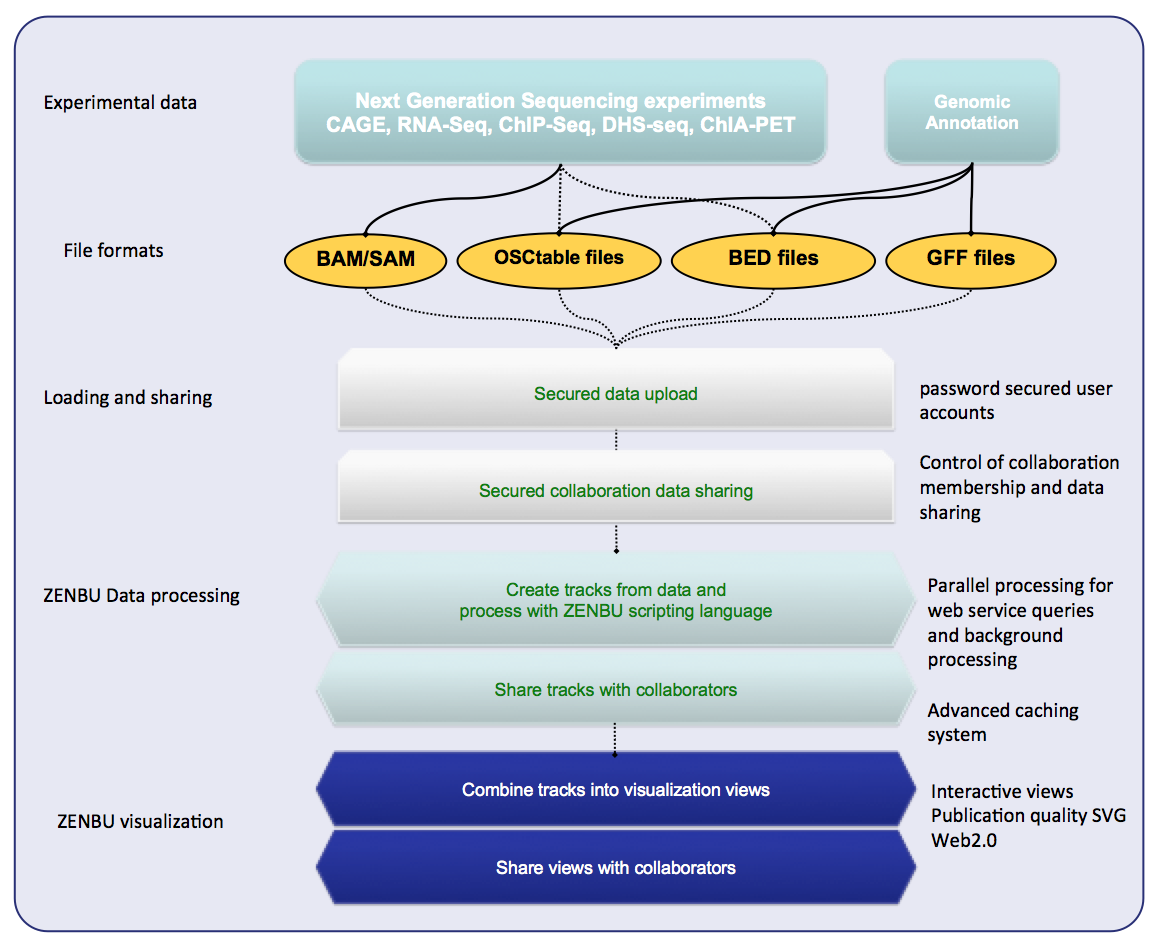
- Secured data upload, user accounts, collaboration sharing
- BigData: 1000s of experiment, unstructured metadata, mining
ZENBU is fundamentally different to other genome browsers
Data is loaded in the same formats used by bioinformaticians for data analysis: Bed, GFF, BAM, or tabbed-text. Not in “visualization ready” formats like wig or bedGraph.
All data in the system was user uploaded. ZENBU’s data curators are just other users of the system. So anyone can create complex visualization and views with their research data and have it presented and shared with the world when they publish.
The concept of a “visualization track” is different in ZENBU. In traditional genome browsers (UCSC, GBrowse) the data pre-processed to make it ready for visualization and just there is one-to-one link between the uploaded files and the visualization tracks. In ZENBU the track is a virtual concept comprised of three aspects: Merged data, real time processing, visualization.
In ZENBU, one or more data sources can be merged together. 1000s of BAM in one track is aceptable. ZENBU is built on a novel high performance C++ code base to enable real time merging and processing of millions of data elements per second.
This leads to the ability in ZENBU to “copy and manipulate” tracks and to create “many visualization tracks from the same source data”.
ZENBU data processing and analysis modules cover a wide range of functions often used by bioinformaticians. ZENBU can perform basic data manipulation processing of filtering (size, distance, signal, overlap, strand, metadata), histogram signal height calculation, collation of signal into annotations. In addition ZENBU can perform some statistical operations with plans to expand this in the future. Currently ZENBU can perform metadata analysis to group experiments together and calculate mean and std-dev (useful for visualizing replicates) and Mann-Whitney rank sum enrichment of metadata and signal to search of significant patterns. Our current plans are to incorporate automatic “lift-over” between assemblies and genomes, and differential expression significance analysis into ZENBU.

Related links
- ZENBU: http://fantom.gsc.riken.jp/zenbu/
- ZENBU documentation wiki:https://zenbu-wiki.gsc.riken.jp/zenbu/wiki/index.php/Main_Page
Reference
- Transcribed enhancers lead waves of coordinated transcription in transitioning mammalian cells, Arner E, Daub CO, Vitting-Seerup K, Andersson R, Lilje B, Drabløs F, Lennartsson A, Rönnerblad M, Hrydziuszko O, Vitezic M. et al. Science. 2015 Feb 27;347(6225):1010-4.
- Interactive visualization and analysis of large-scale sequencing datasets using ZENBU. Severin J, Lizio M, Harshbarger J, Kawaji H, Daub CO, Hayashizaki Y; FANTOM Consortium, Bertin N, Forrest AR. Nat Biotechnol. 2014 Mar;32(3):217-9.
- A promoter-level mammalian expression atlas. Forrest Alistair R.R., Rehli Michael, Kawaji Hideya, Baillie Kenneth, De Hoon Michiel Jan Laurens, Haberle Vanja, Lassmann Timo, Kulakovskiy Ivan, Lizio Marina, Itoh Masayoshi, et al. Nature. 2014 Mar 27;507(7493):462-70.
- FANTOM4 EdgeExpressDB: an integrated database of promoters, genes, microRNAs, expression dynamics and regulatory interactions. Severin J1, Waterhouse AM, Kawaji H, Lassmann T, van Nimwegen E, Balwierz PJ, de Hoon MJ, Hume DA, Carninci P, Hayashizaki Y, Suzuki H, Daub CO, Forrest AR. Genome Biol. 2009;10(4):R39.