- Top
- Facts and Figures of CLST
Facts and Figures of CLST
Members
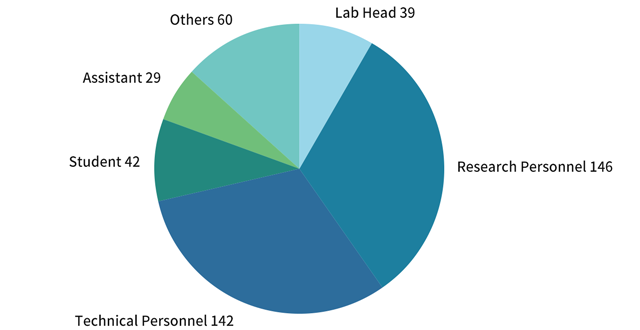
Chart Table
Published papers
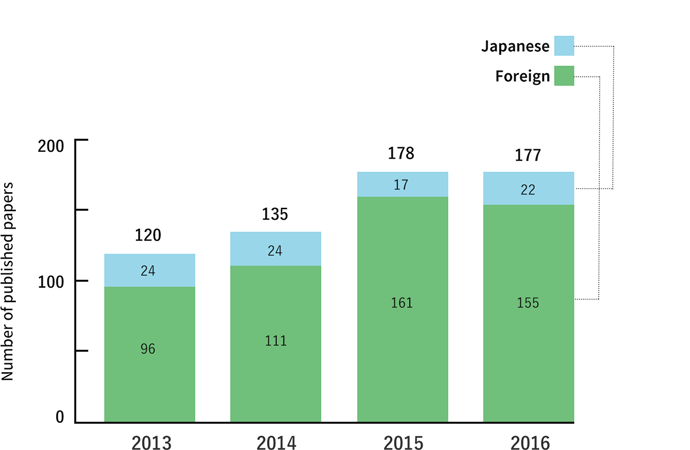
Chart Table
Collaboration Research
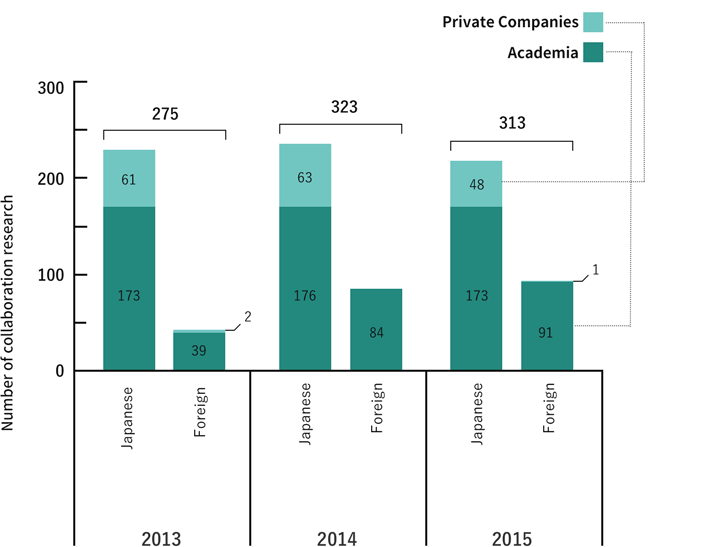
Chart Table
Patent Application
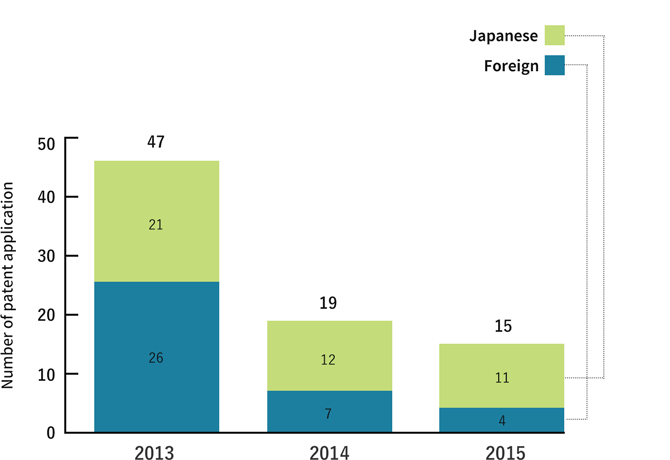
Chart Table
Press Releases
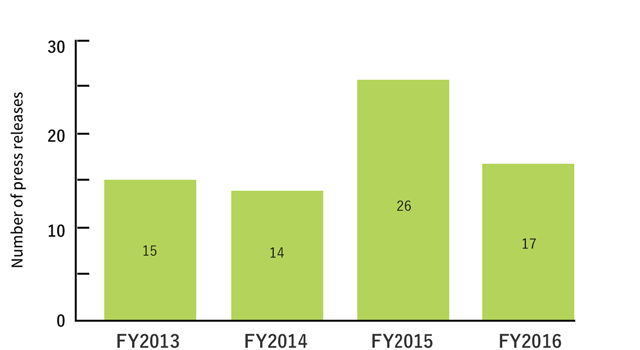
Chart Table
Visitors to our facilities
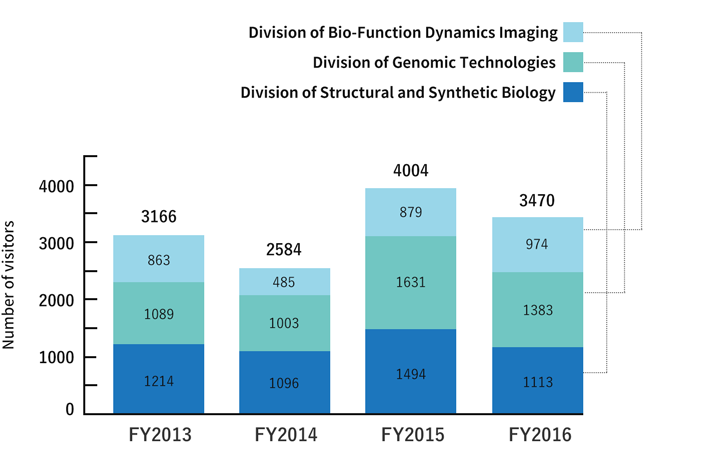
Chart Table
Chart Table
Members
| |
Lab Heads |
Research Personnel |
Technical Personnel |
Students |
Assistants |
Others |
Total |
| 2017 |
39 |
146 |
142 |
42 |
29 |
60 |
458 |
Published Papers
| |
Foreign |
Japanese |
Total |
| 2013 |
96 |
24 |
120 |
| 2014 |
111 |
24 |
135 |
| 2015 |
161 |
17 |
178 |
| 2016 |
155 |
22 |
177 |
Collaboration Research
| |
|
Academia |
Private Companies |
Total |
| 2013 |
Japanese |
173 |
61 |
275 |
| 2013 |
Foreign |
39 |
2 |
| 2014 |
Japanese |
176 |
63 |
323 |
| 2014 |
Foreign |
84 |
0 |
| 2015 |
Japanese |
173 |
48 |
313 |
| 2015 |
Foreign |
91 |
1 |
Patent Application
| |
Foreign |
Japanese |
Total |
| 2013 |
26 |
21 |
47 |
| 2014 |
7 |
12 |
19 |
| 2015 |
4 |
11 |
15 |
Press Releases
| FY2013 |
15 |
| FY2014 |
14 |
| FY2015 |
26 |
| FY2016 |
17 |
Visitors to our facilities
| |
Division of Structural and Synthetic Biology |
Division of Genomic Technologies |
Division of Bio-Function Dynamics Imaging |
Total |
| FY2013 |
1214 |
1089 |
863 |
3166 |
| FY2014 |
1096 |
1003 |
485 |
2584 |
| FY2015 |
1494 |
1631 |
879 |
4004 |
| FY2016 |
1113 |
1383 |
974 |
3470 |